
| |
DIABLO statistics for test1.tmk.com on Wed 20 Oct 1999 |
Generated on 19991020 2355 by feeder-stats v3.92. Copyright © 1999 Iain Lea, BricBrac Consulting.
Diablo running processes:  3    Dnewslink running processes:  0

DIABLO uptime=2291:41 arts=51.362M tested=0 bytes=2661.384G fed=0

11:55PM  up 95 days, 11:43, 4 users, load averages: 1.87, 1.79, 1.83

Filesystem      1K-blocks     Used    Avail Capacity iused   ifree  %iused  Mounted on
/dev/sd0h         1586158   669543   837307    44%      70  396728     0%   /news
/dev/sp0a         8340807  7319219   604547    92%      73  279477     0%   /news/spool/news
| Incoming Feed (+ Freenix #) | Accepted | %Acc | Art/sec | Volume | %Vol | Kb/art | Check | Ihave | Spam | Rejs | Errs | ||
|---|---|---|---|---|---|---|---|---|---|---|---|---|---|
| 1 | news4.new-york.net | #99 | 489922 | 100.00 | 5.69 | 24.34GB | 100.00 | 52.10 | 489926 | 0 | 4 | 4 | 0 |
| Total | 489922 | 100.00 | 5.69 | 24.34GB | 100.00 | 52.10 | 489926 | 0 | 4 | 4 | 0 | ||
|
| Incoming Feed (+ Freenix #) | Volume | %Vol | Kbps | Accepted | %Acc | Kb/art | Check | Ihave | Spam | Rejs | Errs | ||
|---|---|---|---|---|---|---|---|---|---|---|---|---|---|
| 1 | news4.new-york.net | #99 | 24.34GB | 100.00 | 2371.54 | 489922 | 100.00 | 52.10 | 489926 | 0 | 4 | 4 | 0 |
| Total | 24.34GB | 100.00 | 2371.54 | 489922 | 100.00 | 52.10 | 489926 | 0 | 4 | 4 | 0 | ||
|
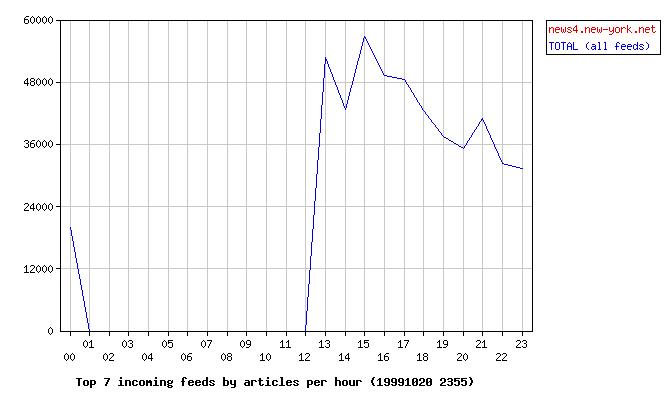
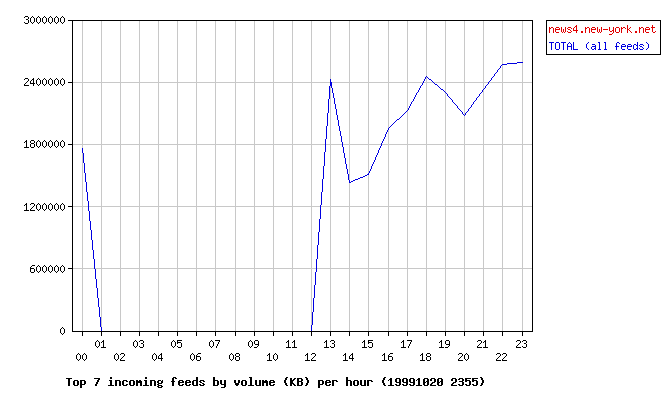
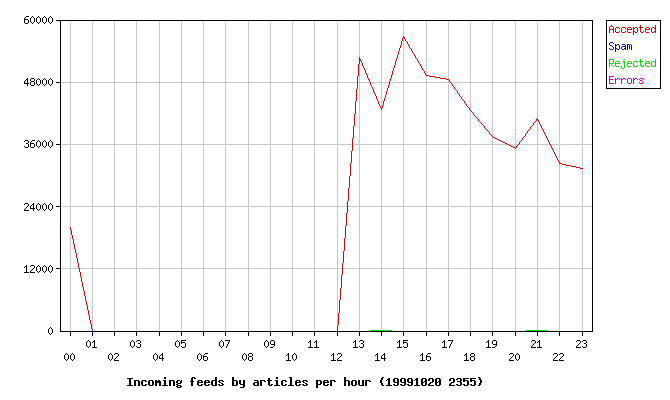
| Hour | Accepted | %Acc | Volume | %Vol | Check | Ihave | Spam | Rejs | Errs |
|---|---|---|---|---|---|---|---|---|---|
| 00 | 19992 | 4.08 | 1.67GB | 6.88 | 19983 | 0 | 0 | 0 | 0 |
| 01 | 0 | 0.00 | 0.00KB | 0.00 | 0 | 0 | 0 | 0 | 0 |
| 02 | 0 | 0.00 | 0.00KB | 0.00 | 0 | 0 | 0 | 0 | 0 |
| 03 | 0 | 0.00 | 0.00KB | 0.00 | 0 | 0 | 0 | 0 | 0 |
| 04 | 0 | 0.00 | 0.00KB | 0.00 | 0 | 0 | 0 | 0 | 0 |
| 05 | 0 | 0.00 | 0.00KB | 0.00 | 0 | 0 | 0 | 0 | 0 |
| 06 | 0 | 0.00 | 0.00KB | 0.00 | 0 | 0 | 0 | 0 | 0 |
| 07 | 0 | 0.00 | 0.00KB | 0.00 | 0 | 0 | 0 | 0 | 0 |
| 08 | 0 | 0.00 | 0.00KB | 0.00 | 0 | 0 | 0 | 0 | 0 |
| 09 | 0 | 0.00 | 0.00KB | 0.00 | 0 | 0 | 0 | 0 | 0 |
| 10 | 0 | 0.00 | 0.00KB | 0.00 | 0 | 0 | 0 | 0 | 0 |
| 11 | 0 | 0.00 | 0.00KB | 0.00 | 0 | 0 | 0 | 0 | 0 |
| 12 | 0 | 0.00 | 0.00KB | 0.00 | 0 | 0 | 0 | 0 | 0 |
| 13 | 52687 | 10.75 | 2.32GB | 9.52 | 52687 | 0 | 0 | 0 | 0 |
| 14 | 42794 | 8.73 | 1.37GB | 5.63 | 42803 | 0 | 3 | 3 | 0 |
| 15 | 56793 | 11.59 | 1.44GB | 5.93 | 56793 | 0 | 0 | 0 | 0 |
| 16 | 49293 | 10.06 | 1.86GB | 7.64 | 49294 | 0 | 0 | 0 | 0 |
| 17 | 48455 | 9.89 | 2.02GB | 8.31 | 48456 | 0 | 0 | 0 | 0 |
| 18 | 42617 | 8.70 | 2.35GB | 9.63 | 42615 | 0 | 0 | 0 | 0 |
| 19 | 37542 | 7.66 | 2.19GB | 9.01 | 37542 | 0 | 0 | 0 | 0 |
| 20 | 35153 | 7.18 | 1.98GB | 8.15 | 35153 | 0 | 0 | 0 | 0 |
| 21 | 40936 | 8.36 | 2.22GB | 9.12 | 40940 | 0 | 1 | 1 | 0 |
| 22 | 32286 | 6.59 | 2.45GB | 10.06 | 32285 | 0 | 0 | 0 | 0 |
| 23 | 31374 | 6.40 | 2.47GB | 10.13 | 31375 | 0 | 0 | 0 | 0 |
| Total | 489922 | 100.00 | 24.34GB | 100.00 | 489926 | 0 | 4 | 4 | 0 |
|
| Outgoing Feed (+ Freenix #) | Accepted | %Acc | Art/sec | Volume | %Vol | Kb/art | Dups | Rejs | ||
|---|---|---|---|---|---|---|---|---|---|---|
| Total | 0 | 0.00 | 0.00 | 0.00KB | 0.00 | 0.00 | 0 | 0 | ||
| Outgoing Feed (+ Freenix #) | Volume | %Vol | Kbps | Accepted | %Total | Kb/art | Dups | Rejs | ||
|---|---|---|---|---|---|---|---|---|---|---|
| Total | 0.00KB | 0.00 | 0.00 | 0 | 0.00 | 0.00 | 0 | 0 | ||
| >= 20% Full | >= 35% Full | >= 50% Full | >= 65% Full | >= 80% Full | >= 95% Full |
| Outgoing Feed | Batch Seq | Batch Num | Batch Max | %Full |
|---|
| 1st Time | Last Time | # Msgs | Message |
|---|
| Host | By Post Rate | By Dup Body | # Articles |
|---|---|---|---|
| 212.151.37.96 | 1 | 0 | 1 |
| 195.80.1.98 | 1 | 0 | 1 |